Answer: The true statements are -The graph has an x-intercept and a y-intercept, The point (0, 2.6) is on the graph and the graph increases from left to right.
Explanation:
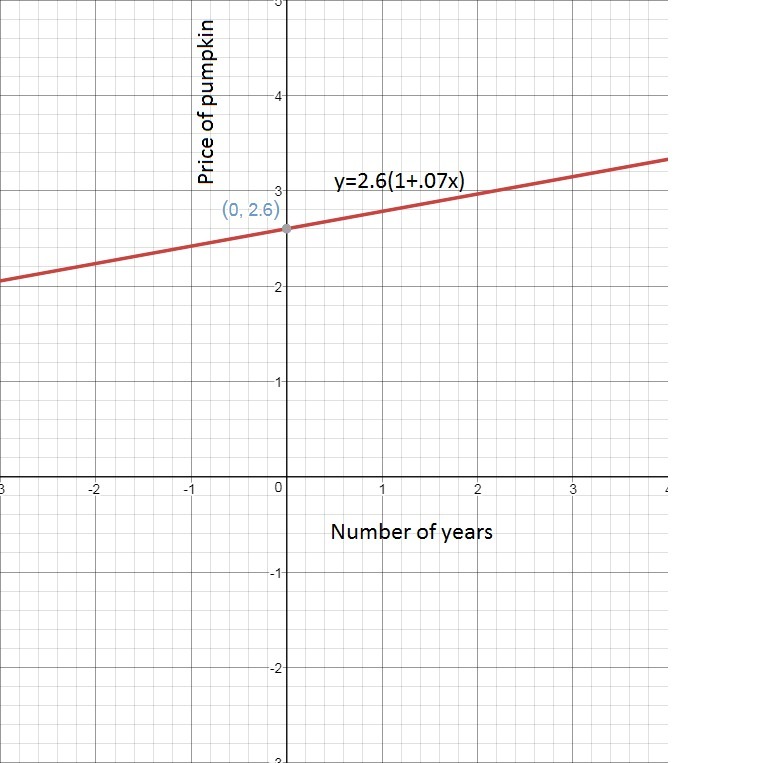
Since, initially, the value of pumpkin is $2.60 and it is increasing every year at the rate of 7%.
So, the function which obtained with the help of formula 
f(x)= 2.6(1+.07x), where x (let) is the number of year and f(x) is the price of pumpkin.
So, after drawing the graph of function f(x) we found it takes the initial point (0,2.6)
And, it has both x-intercept and y-intercept.
Moreover, the graph is increasing in the positive x-axis from let to right.
Thus, second, fourth and sixth statements are correct.