Answer:
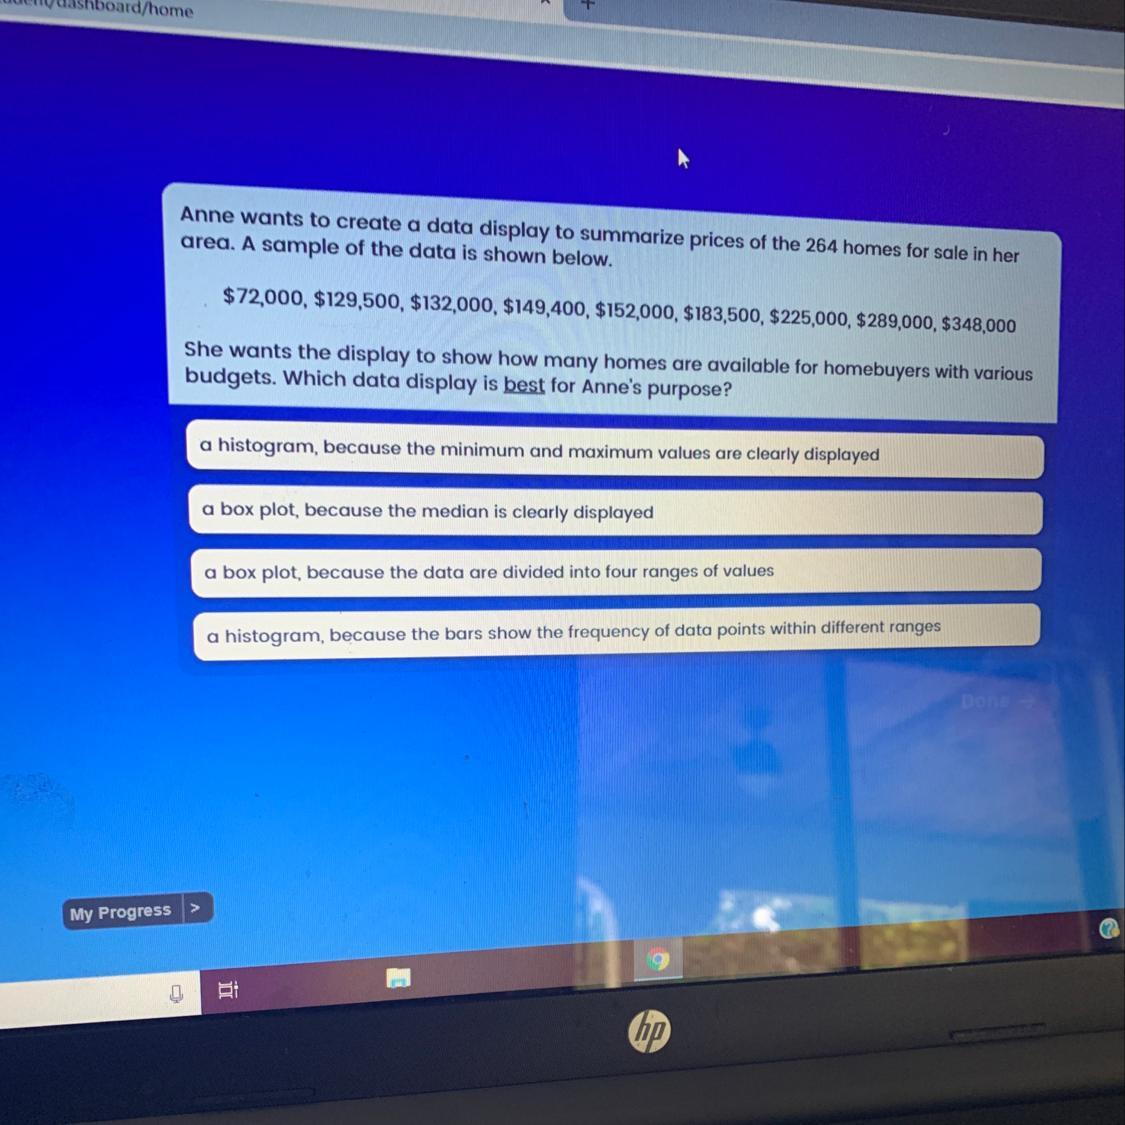
The correct option is (D).
Step-by-step explanation:
The boxplot is a consistent way to exhibit the data-distribution based on, minimum, first quartile, median, third quartile and maximum.
Therefore we can say it provides information about the location of the center, dispersion and skewness (measure of asymmetry) of the data.
The methods commonly used for depicting a frequency distribution are:
- Histogram/Column graph
- Bar graph
- Frequency Polygon
- Pie chart
Out of these, one of the most general and extensively used devices of illustrating a frequency distribution is the histogram.
In this case it is provided that Anne wants the display of prizes to show how many homes are available for home buyers with various budgets.
So, Anne can set range of budget values and assign the number of buyers with various budgets.
From the provided data the range of budget values can be set as:
Less than $50,000
$50,000 - $100,000
$100,000 - $150,000
$150,000 - $200,000
$200,000 - $250,000
$250,000 - $300,000
$300,000 - $350,000
Thus, the histogram data display is best for Anne's purpose.
The correct option is (D).