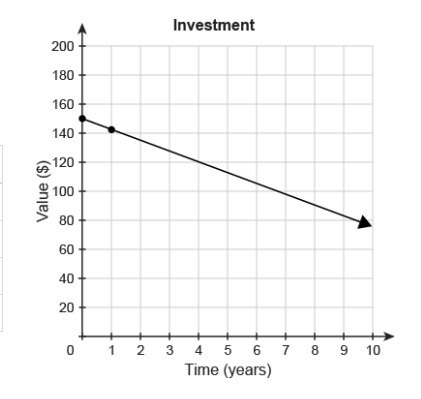
The linear function in the graph shows the value, in dollars, of an investment in years after 2012; with the y-intercept between 140 and 160.
The exponential function in the table represents the balance of a savings account, in dollars, over time in years after 2012:
Years since 2012 Savings account balance ($)
2 180
3 540
4 1620
5 4860
Each year the balance increases by a factor of 3. So the y-intercept at Year 0 = Year 2/3^2 = 180/9
=20
That is approximately 130 less than the y-intercept of the linear function.
The answer is B.