answer.
Ask question
Login Signup
Ask question
All categories
  • English
  • Mathematics
  • Social Studies
  • Business
  • History
  • Health
  • Geography
  • Biology
  • Physics
  • Chemistry
  • Computers and Technology
  • Arts
  • World Languages
  • Spanish
  • French
  • German
  • Advanced Placement (AP)
  • SAT
  • Medicine
  • Law
  • Engineering
ad-work [718]
2 years ago
15

The data represented by the graph is normally distributed and adheres to the 68-95-99.7 rule. the standard deviation of this dat

a is (drop down menu), and (drop down menu2)% of the population will fall below the mark of 7.
drop down menu1-
-6.6
1.8
2.2
4.8

drop down menu2-
34
68
84
95

Mathematics
1 answer:
jenyasd209 [6]2 years ago
8 0

Answer:

i)

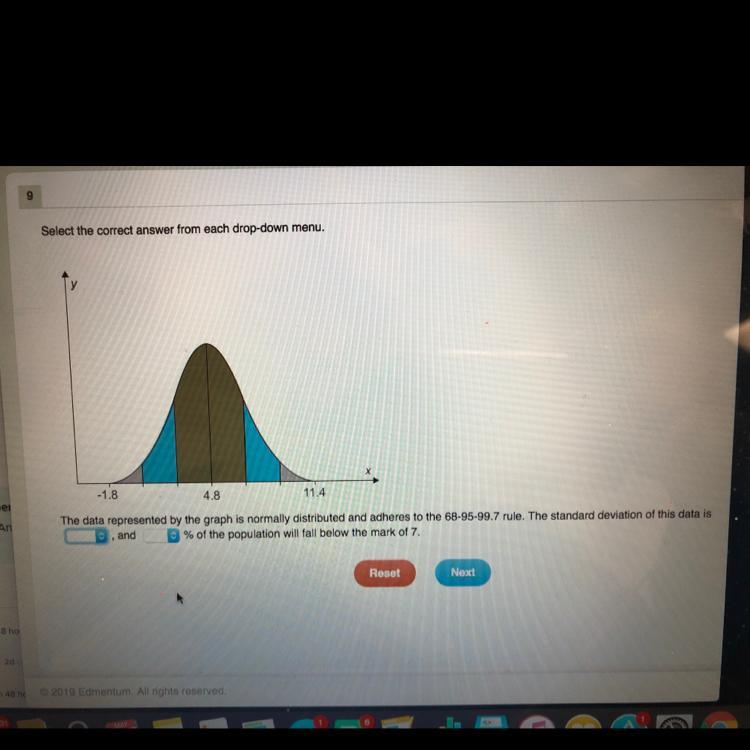
the standard deviation of this data is 2.2

ii) 84%

Step-by-step explanation:

We have been informed that the data represented by the graph is normally distributed and adheres to the 68-95-99.7 rule. This implies that we shall be dealing with the applications of the empirical rule.

In a normal distribution, the mean is also the mode as well as the median of the distribution. This implies that the mean is at the center of the distribution. In our case, the mean is 4.8. The vertical lines represents data points that lie 1, 2 and 3 standard deviations away from the mean.

From the graph, both 11.4 and -1.8 lie 3 standard deviations away from the mean on either side. We can thus use the following equation to solve for the unknown standard deviation;

mean + 3(sigma) = 11.4

where sigma is the standard deviation.

our mean is 4.8, therefore;

4.8 + 3(sigma) = 11.4

3(sigma) = 6.6

sigma = 2.2

ii)

In order to determine the percentage of the population that will fall below the mark of 7, we shall first determine how many standard deviations away from the mean the value 7 lies.

To do this, we can use the following equation;

4.8 + n(2.2) = 7

2.2n = 2.2

n = 1

Therefore, the data point 7 lies one standard deviation away from the mean to the right.

The percentage of the population that will fall below one standard deviation away from the mean is;

68 + 13.5 + 2.35 = 83.85%

Using the empirical rule

You might be interested in
Gary used landscape timbers to create a border around a garden shaped like a right triangle. The longest two timbers he used are
Cloud [144]

Answer:

9 feet

Step-by-step explanation:

Given:

The border of the garden is a right angled triangle.

Two lengths are given as 12 ft and 15 ft.

Let the length of the shortest timber be 'x' feet.

Now, in a right angled triangle, the longest length is called the hypotenuse.

As 15 feet is the largest length, it is the hypotenuse of the triangle. Now, applying Pythagoras theorem, we get:

(Leg1)^2+(Leg2)^2=(Hypotenuse)^2\\x^2+12^2=15^2\\x^2+144=225\\x^2=225-144\\x^2=81\\x=\pm \sqrt{81}=\pm 9

The negative value is neglected as length can never be negative.

Therefore, the length of the shortest timber is 9 feet.

8 0
2 years ago
Which of the statements below is true concerning bar​ graphs? Choose the correct answer below.
nordsb [41]

Answer:

C. The height of each bar represents the category's frequency or relative frequency

Step-by-step explanation:

8 0
2 years ago
In a study conducted to examine the quality of fish after 7 days in ice​ storage, ten raw fish of the same kind and approximatel
vesna_86 [32]

Question: The sample data and the scatter plot was not added to your question. See the attached file for the scatter plot.

Answer: Yes

Step-by-step explanation:

From scatter plot, it was discovered that there is a linear relationship between the two variables and both variables are quantitative.

Therefore, it appropriate to use the correlation coefficient to describe the strength of the relationship between​ "Time" and​ "Fish Quality"?

4 0
2 years ago
A department store finds that in a random sample of 200 customers, 60% of the sampled customers had browsed its website prior to
vfiekz [6]

Answer:

between 108-110?

Step-by-step explanation:

60% or 200 = 120 people

90% of 120 = 108

question doesnt look complete so this is the best I could come up with...‍♀️

3 0
2 years ago
The graph shows the function representing the recommended amount of mulch, in cubic yards, for circular flowerbeds based on the
MAVERICK [17]

Answer: 13

Step-by-step explanation:

4 0
2 years ago
Other questions:
  • Six times a certain number is 16 more than twice the number
    13·2 answers
  • Which of these expressions is equivalent to log (20 27)
    5·1 answer
  • A company buys paper clips at the rate of $7.50 per box for the first 10 boxes, $5.50 per box for the next 10 boxes, and $3.50 p
    14·1 answer
  • Two unique letters are chosen at random from the alphabet. What is the approximate probability that the first letter chosen is A
    9·1 answer
  • A shoe manufacturer compared material A and material B for the soles of shoes. Twelve volunteers each got two shoes. The left wa
    11·1 answer
  • A taxi cab in myrtle beach charges $2 per mile and $1 for every person. If a taxi cab ride for two people costs $12, how far did
    7·1 answer
  • 70.18 divided by 0.9 round the answer to the nearest hundredth
    6·2 answers
  • Find the measure for ∠XQL.
    7·1 answer
  • Herb, a tennis player, has been struggling to develop a more consistent serve. He made the following remark to his partner durin
    11·1 answer
  • A caplet contains 325 mg of medication. How many caplets contain 975 mg of medication?
    8·1 answer
Add answer
Login
Not registered? Fast signup
Signup
Login Signup
Ask question!