Answer:
Magnitude of force P = 25715.1517 N
Explanation:
Given - The wires each have a diameter of 12 mm, length of 0.6 m, and are made from 304 stainless steel.
To find - Determine the magnitude of force P so that the rigid beam tilts 0.015∘.
Proof -
Given that,
Diameter = 12 mm = 0.012 m
Length = 0.6 m
 = 0.015°
Youngs modulus of elasticity of 34 stainless steel is 193 GPa
Now,
By applying the conditions of equilibrium, we have
∑fₓ = 0, ∑ = 0, ∑M = 0
If ∑ = 0
= 0
⇒ ×0.9 - P × 0.6 = 0
⇒×3 - P × 2 = 0
⇒ = 
If ∑ = 0
= 0
⇒ ×0.9 = P × 0.3
⇒ ×3 = P
⇒ = 
Now,
Area, A =  = 1.3097 × 10⁻⁴ m²
We know that,
Change in Length ,  =
= 
Now,
 = 9.1626 × 10⁻⁹ P
 = 1.83253 × 10⁻⁸ P
Given that,
= 0.015°
⇒ = 2.618 × 10⁻⁴ rad
So,

⇒2.618 × 10⁻⁴ = ( 1.83253 × 10⁻⁸ P - 9.1626 × 10⁻⁹ P) / 0.9
⇒P = 25715.1517 N
∴ we get
Magnitude of force P = 25715.1517 N
The total amount of daily heat transfer is 1382.38 M w.
The temperature on the outside surface of the gypsum plaster insulation is 17.96 ° C.
<u>Explanation:</u>
Given data,
 = 10° C
 = 250 w/
  k
k
Pipe length = 20 m
Inner diameter  = 6 cm,
  = 3 cm
Outer diameter  = 8 cm,
  = 4 cm
The thickness of insulation is 4 cm.
 = + 4
= + 4
= 4+4
= 8 cm
is the heat transfer coefficient of convection inside,  is the heat transfer coefficient of convection outside.
The heat transfer rate between ambient and steam is
 watt
watt
=  watt
watt
=  watt
watt
q = 15999.86 watt
The total amount of daily heat transfer = 15999.86 × 86400
= 1382.387904 watt
= 1382.38 M w
The total amount of daily heat transfer is 1382.38 M w.
b) The temperature on the outside surface of the gypsum plaster insulation.
q = 
15999.86 
 - 10 = 7.96
= 17.96 ° C.
Answer:
The solution for the given problem is done below.
Explanation:
M1 = 2.0
 = 0.3636
 = 0.5289
 = 0.7934
Isentropic Flow Chart: M1 = 2.0 ,  = 1.8
= 1.8
T1 =  (1.8)(288K) = 653.4 K.
In order to choke the flow at the exit (M2=1), the above T0* must be stagnation temperature at the exit.
At the inlet,
T02=  = (1.8)(288K) = 518.4 K.
Q= Cp(T02-T01) =  = 135.7*
 J/Kg.
J/Kg.
Answer:

Now we can decide based on the significance level  . If
. If  we reject the null hypothesis and in other case we FAIL to reject the null hypothesis.
 we see that
  so then we have enough evidence to reject the null hypothesis and we can conclude that the true mean is significantly less than 15
 we see that
  so then we have enough evidence to FAIL to reject the null hypothesis and we can conclude that the true mean is NOT significantly less than 15
 we see that so then we have enough evidence to FAIL to reject the null hypothesis and we can conclude that the true mean is NOT significantly less than 15
Explanation:
For this case they conduct the following system of hypothesis for the ture mean of interest:
Null hypothesis: 
Alternative hypothesis: 
The statistic for this hypothesis is:

And on this case the value is given 
For this case in order to take a decision based on the significance level we need to calculate the p value first.
Since we have a lower tailed test the p value would be:
Now we can decide based on the significance level . If we reject the null hypothesis and in other case we FAIL to reject the null hypothesis.
we see that so then we have enough evidence to reject the null hypothesis and we can conclude that the true mean is significantly less than 15
we see that so then we have enough evidence to FAIL to reject the null hypothesis and we can conclude that the true mean is NOT significantly less than 15
we see that so then we have enough evidence to FAIL to reject the null hypothesis and we can conclude that the true mean is NOT significantly less than 15
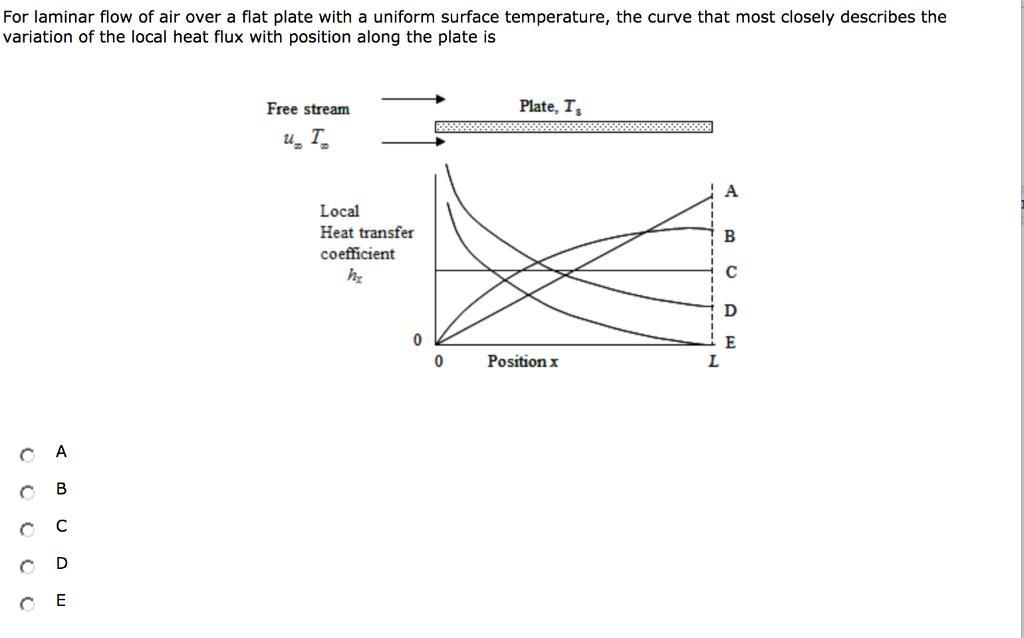
This question is incomplete, the missing diagram is uploaded along this answer below;
Answer:
from the diagram, the curve that most closely describes the variation of the local heat transfer coefficient with position along the plate is Option D
Explanation:
Given the data in the question;
We write the expression for the local Nusselt number for Laminar flow over the flat plate;
Nu = 


Nu = 
 =
= 

 =
= 
Next we write down the expression for the local heat flux from the plate with uniform surface temperature;
q =  T
T - T∞ )
q ∝
∴
q ∝
The local heat flux decreases with the position as it is inversely proportional to the square root of the position from the leading edge and it will not be zero at the end of the plate.
Therefore, from the diagram, the curve that most closely describes the variation of the local heat transfer coefficient with position along the plate is Option D