Answer:
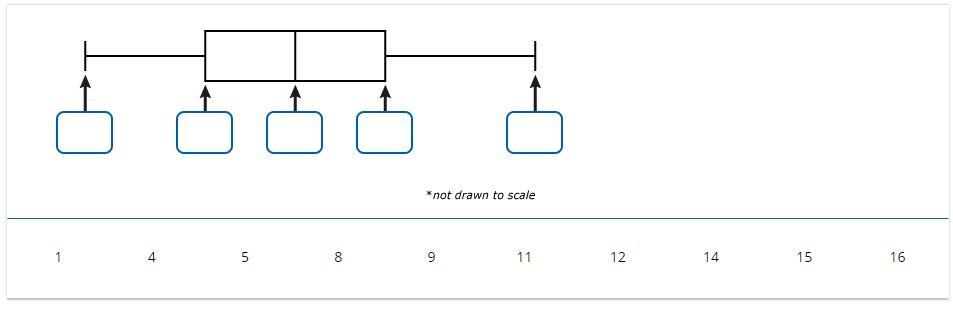
So, filling the box plot from left to right, we have the following values;
1 , 5, 8 , 11, 16
Step-by-step explanation:
Here in this question, we are interested in fixing the values in the box plot from the data given.
Mathematically, the box plot shows 5 values;
going from left to write at each point, we have
minimum value
lower quartile also called Q1
Median
Upper quartile also called Q3
and lastly;
Maximum value
From the question;
minimum value = 1 while maximum value = 16
So also, the median should be easy to obtain.
the median is simply the middle number;
We have 15 numbers in the set;
So therefore the median is the 8th number, counting from any of the ends of the arranged set.
From the data, this is a value of 8
Now let’s calculate the lower quartile
To calculate the lower quartile, we just add 1 to the total and divide by 4
= (N + 1)/4
That would be (15 + 1)/4 = 16/4 = 4
So the lower quartile will be the 4th term which is 5
Now, let’s calculate the upper quartile;
= (N + 1) * 3/4 = (15 + 1)* 3/4 = 3/4 * 16 = 12th term
By counting, this is 11