Answer:
a) Total book value = $85,000,000
b)Market value of debt = $27,650,000
c)After tax cost of debt = 2.74%
Explanation:
As per the data given in the question,
a) Debt = $50,000,000
Zero coupon bond = $35,000,000
Total book value = $50,000,000+$35,000,000
= $85,000,000
b) Market value of debt = $50,000,000×104%
=$52,000,000
Market value of zero coupon bond = $35,000,000×79%
=$27,650,000
Total market value = $52,000,000+$27,650,000
= $79,650,000
c) Market value weights for debt = 0.65
Market value weights for Zero coupon bond = 0.35
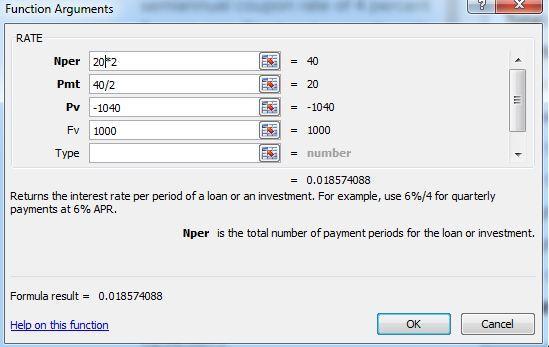
After tax cost for Debt ( By using financial calculator )
( 0.01857 ×2 × (1-24%)) = 2.82%
After tax cost for Zero coupon bond ( By using financial calculator )
( 0.01698 ×2 × (1-24%)) = 2.58%
Weighted cost for debt ( Weight × Cost )= 1.84%
Weighted cost for zero coupon bond ( Weight × Cost ) = 0.90%
After tax cost of debt = 1.84%+0.90%
=2.74%