Answer:
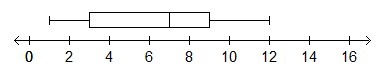
The box plot will have a whisker at 1; left side of the box at 3; middle line of the box at 7; right side of the box at 9; and whisker at 12.
Step-by-step explanation:
To construct a box plot, we first ensure the data is ordered from least to greatest. This set is.
Next we find the median. To do this, we find the middle value. The middle of this data set is 7. This will be the middle line of the box.
Next we find the UQ (upper quartile). This is the median of the upper half of data, split by the median. The upper half of the data is 8, 8, 10, 12; the middle of this is between 8 and 10. To find the middle, add the two together and divide by 2:
(8+10)/2 = 18/2 = 9.
This is our UQ. This will be the right side of the box.
Next we find the LQ (lower quartile). This is the median of the lower half of data, split by the median. The lower half of data is 1, 1, 5, 7; the middle of this is between 1 and 5. To find the middle, add the two together and divide by 2:
(1+5)/2 = 6/2 = 3
This is our LQ. This will be the left side of the box.
We now draw a whisker from the left side of the box to the lowest value, 1. Lastly, draw a whisker from the right side of the box to the highest value, 12.